The exchange of goods and services through the internet is referred to as e-commerce or electronic commerce. It entails the exchange of data, cash, goods and services between organizations, clients and other individuals. The utilization of the internet facilitates transactions in this company model.
Today, e-commerce has benefited from the internet's extensive reach and is predicted to be a global industry worth $5.7 trillion USD. In fact, e-commerce currently makes it possible to purchase a variety of products and services.
In this article, we'll go over every important detail about the e-commerce industry in Australia. Here’s what we’ll be discussing:
Table of Contents []
- General Statistics for E-commerce in Australia
- Top Australian Online Companies
- Australia's Best-selling E-commerce Categories
- Amount of Money Spent Online
- Percentage of People Who Made Online Purchases in the Past Year
- Purchase Frequency Among Online Shoppers in Australia in 2022
- Growth in Online Sales in Australia from April 2019 to April 2021
- The Size and Inspiration of Online Transactions
- Average Time Spent Online Shopping in Australia
- Payment Methods that Facilitate E-commerce in Australia in 2022
- Share of Consumers Who Engage in Hybrid Online and In-store Purchasing in Australia in 2021
- Factors Considered Very Important to Shoppers When Making an Online Purchase in Australia in 2021
- Percentage of Consumers Who Shop Online and Offline on a Weekly Basis in the US, UK, and Australia in 2022
- E-commerce Advantages in Australia
- E-commerce Difficulties in Australia
- Conclusion
General Statistics for E-commerce in Australia

Before we get started, let us go over the following e-commerce highlights:
- By 2025, it is anticipated that the Australian e-commerce market will be worth $35 billion USD.
- 52.7% of Australian internet users bought products or services online.
- Australian online retail sales are expected to grow by 18.1% between 2018 and 2023.
- In 2023, Australia's internet shopping market is projected to grow by 6.6%.
- Australia's online retail market is estimated to reach $56.2 billion in 2023.
- In the previous year, around 67.7% of Australians purchased something online.
- Mobile devices are used for purchases by 42.5% of online customers.
- The overall value of transactions through digital channels was $80.10 billion USD or around $4,036 dollars per user of digital payments.
- The Thematic Reports ranks the Australian internet retail industry eighth in the world in terms of market size.
- Between 2017 and 2022, the online retail market size increased by 19.6% annually.
Top Australian Online Companies
It would be wrong to discuss the success of e-commerce firms in Australia without bringing up the impact that COVID-19 had on the industry. For the first time ever during the pandemic, about 2.5 million Australians shopped online. The pandemic altered shopping styles in addition to how companies interact with their clients.
Here are some statistics showing the share of global consumers that decided to shop online due to COVID-19, and what they buy.
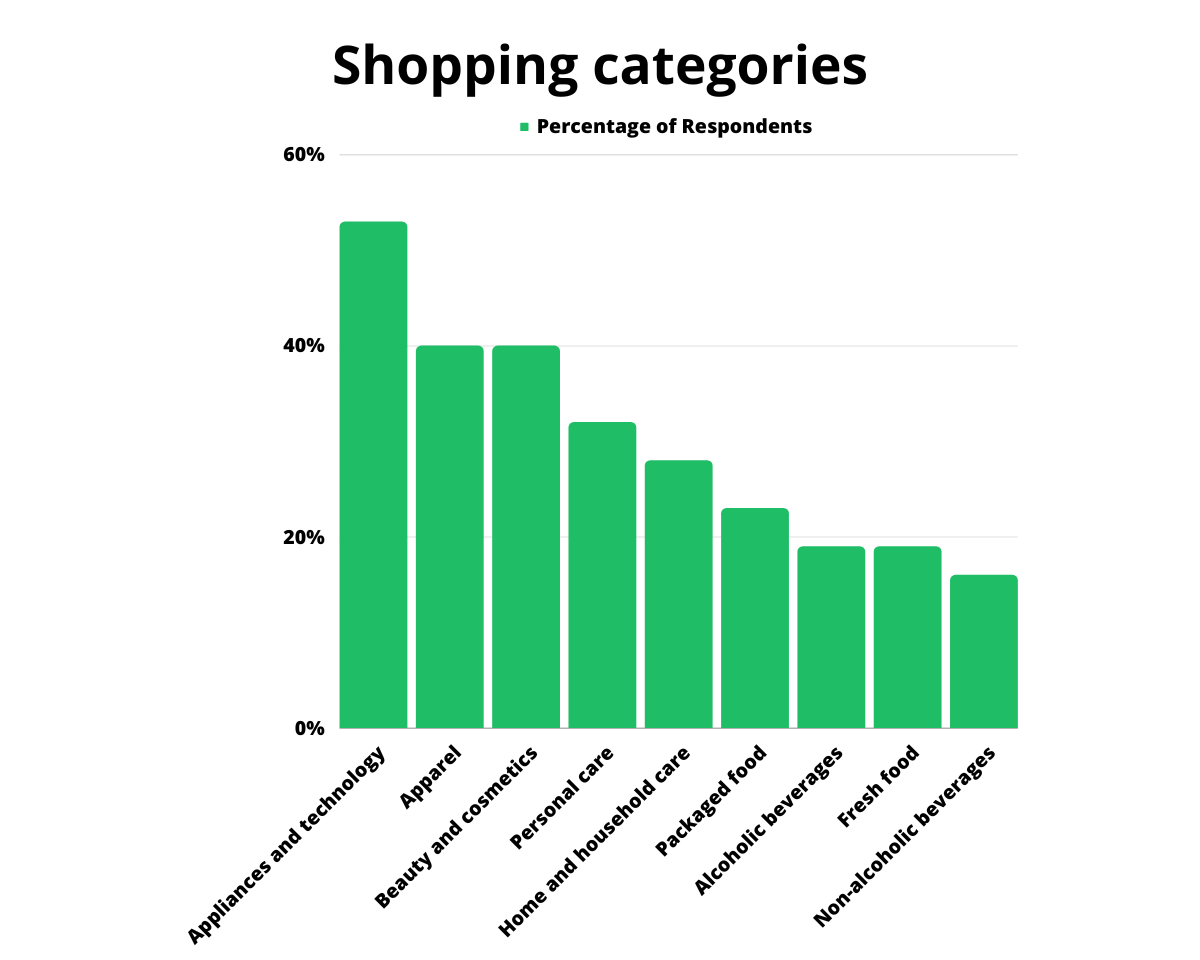
| Shopping Category | Percentage of Respondents |
| Appliances and technology | 53% |
| Apparel | 40% |
| Beauty and cosmetics | 40% |
| Personal care | 32% |
| Home and household care | 28% |
| Packaged food | 23% |
| Alcoholic beverages | 19% |
| Fresh food | 19% |
| Non-alcoholic beverages | 16% |
Source: Statista
With this increase in the adoption of e-commerce, there are currently roughly 85,327 registered online shopping enterprises in Australia. To stay competitive, many businesses have had to adopt an e-commerce model.
Some of the top online companies in Australia, based on their website’s monthly traffic, are as follows:
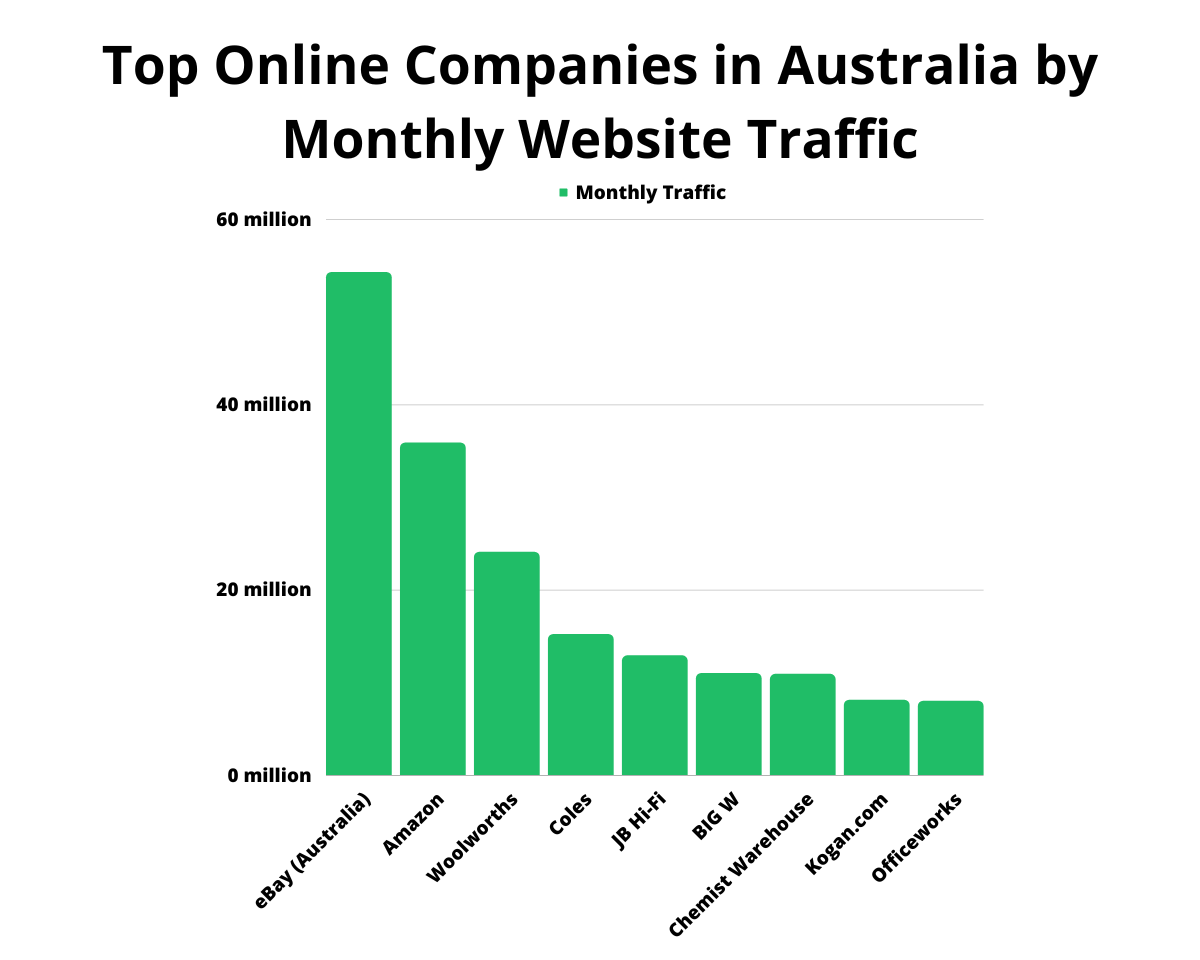
| E-commerce Company | Monthly Traffic |
| eBay (Australia) | 54.3 million |
| Amazon | 35.9 million |
| Woolworths | 24.1 million |
| Coles | 15.2 million |
| JB Hi-Fi | 12.9 million |
| BIG W | 11 million |
| Chemist Warehouse | 10.9 million |
| Kogan.com | 8.1 million |
| Officeworks | 8 million |
Source: Magenest
Many companies are now thriving due to the development and changes in customer shopping behaviour. Here is the breakdown of the amount of revenue generated by some of the leading E-commerce firms:
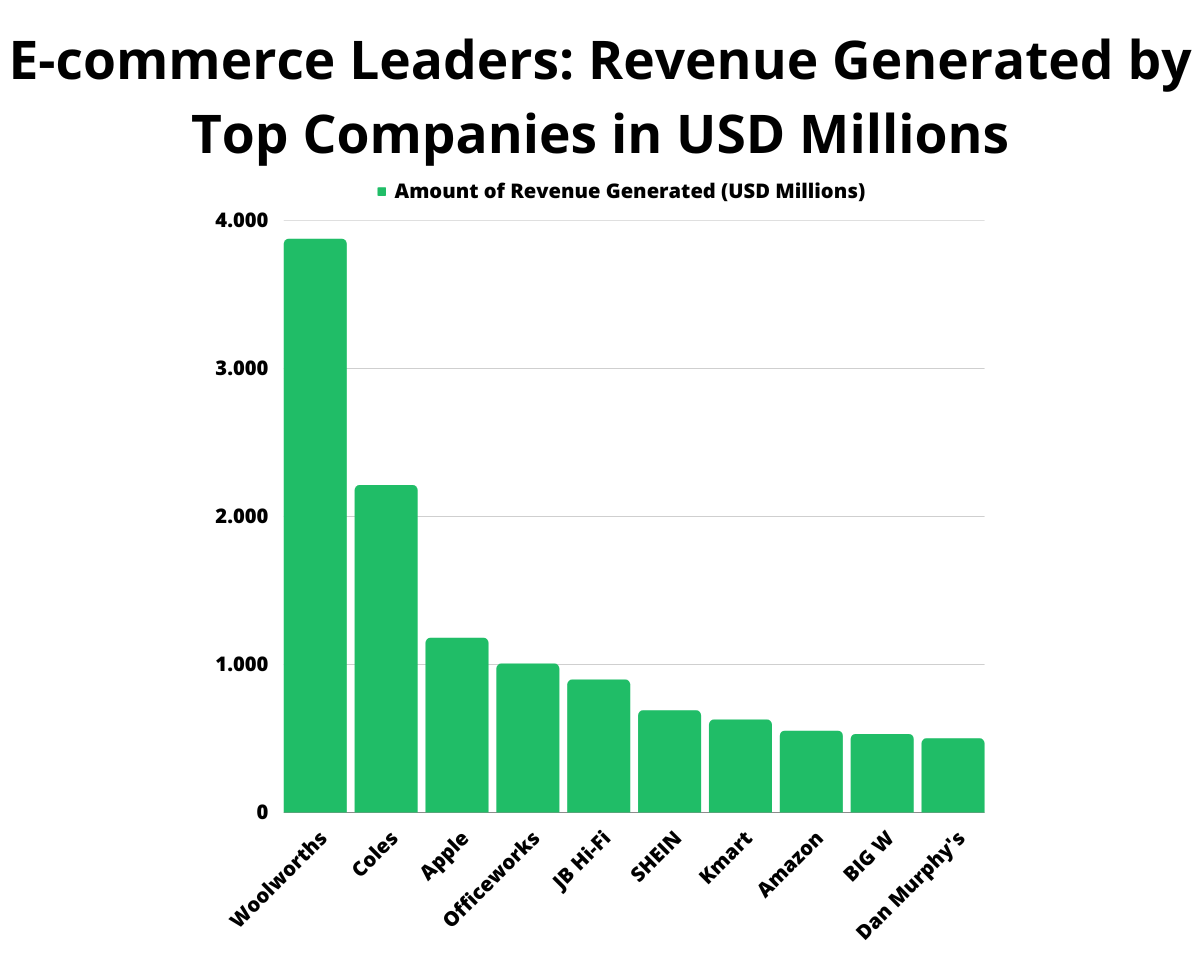
| E-commerce Company | Amount of Revenue Generated (USD Millions) |
| Woolworths | 3,874 |
| Coles | 2,211 |
| Apple | 1,179 |
| Officeworks | 1,004 |
| JB Hi-Fi | 897 |
| SHEIN | 688 |
| Kmart | 626 |
| Amazon | 551 |
| BIG W | 529 |
| Dan Murphy's | 499 |
Source: Statista
Australia's Best-selling E-commerce Categories
Australians prefer domestic products and favour local enterprises in their communities; according to a Commonwealth Bank survey, more than 50% of Australian customers favour buying things created and supplied locally. Below is a breakdown of the top e-commerce product categories that Australian shoppers are most likely to buy.
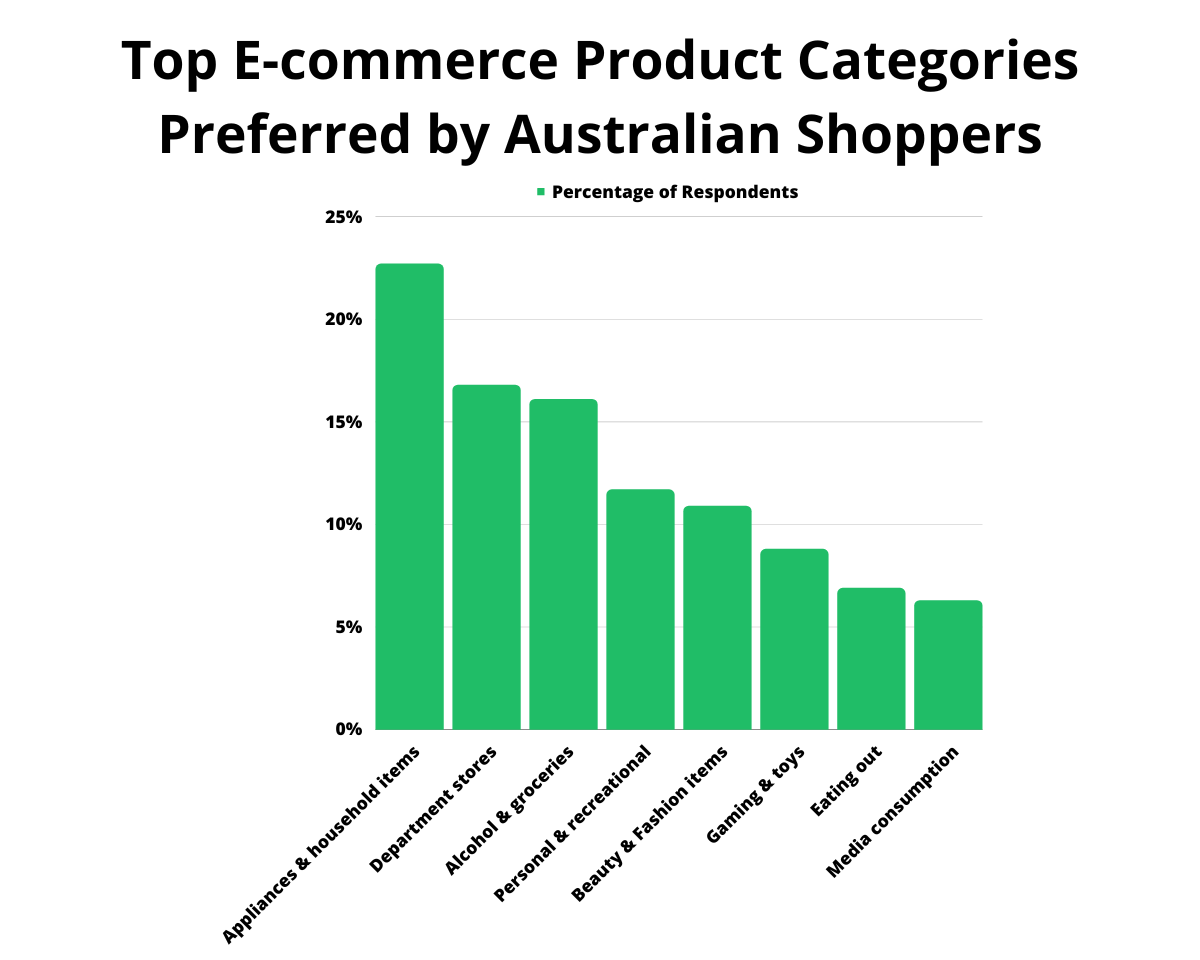
| Category | Percentage of Respondents |
| Appliances & household items | 22.7% |
| Department stores | 16.8% |
| Alcohol & groceries | 16.1% |
| Personal & recreational | 11.7% |
| Beauty & Fashion items | 10.9% |
| Gaming & toys | 8.8% |
| Eating out | 6.9% |
| Media consumption | 6.3% |
Source: Statista
Amount of Money Spent Online
Total spending on goods sold online is $62.3bn AUD. This is how the figure compares to the retail e-commerce sales worldwide from 2015 to 2026 (in billion U.S. dollars).
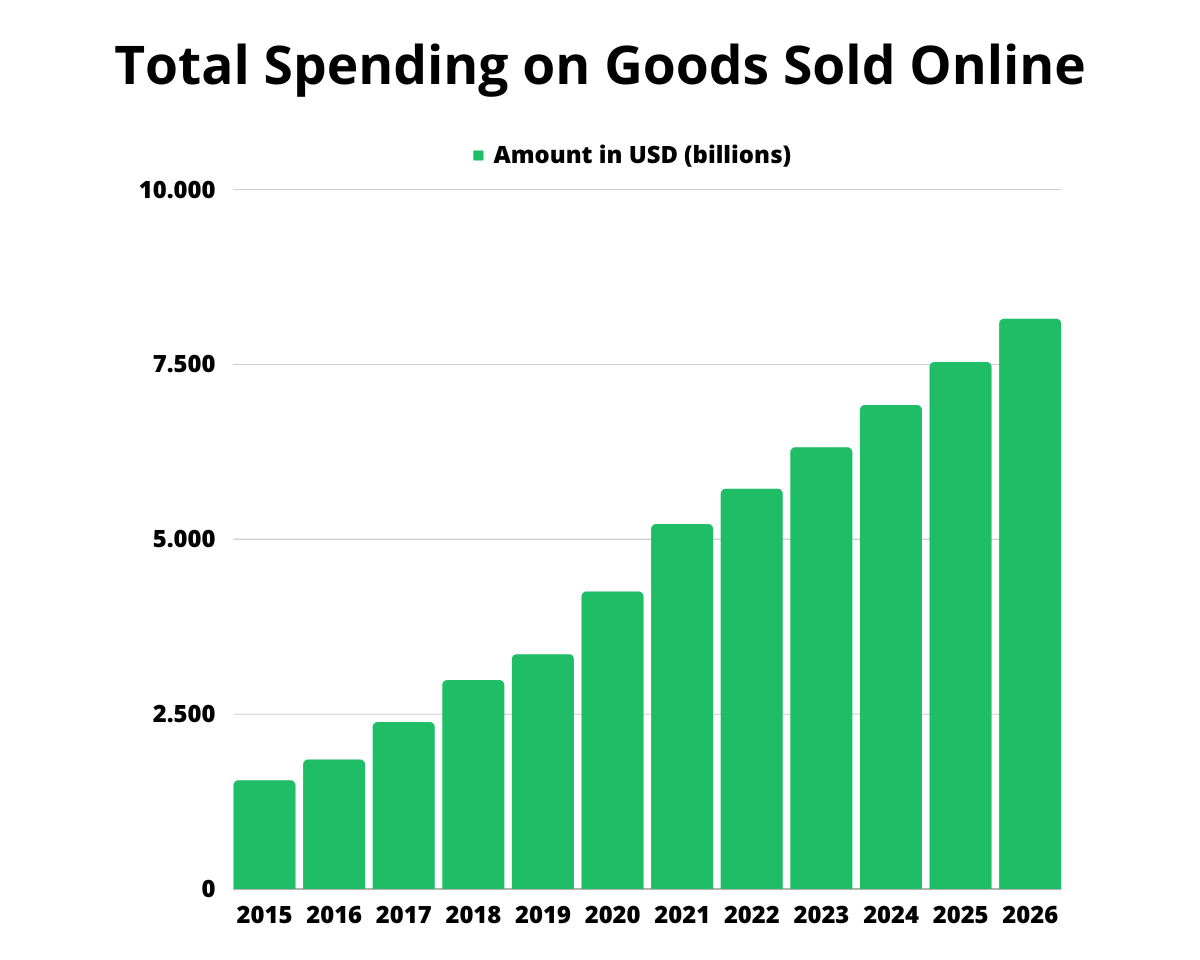
| Year | Amount in USD (billions) |
| 2015 | 1,548 |
| 2016 | 1,845 |
| 2017 | 2,382 |
| 2018 | 2,982 |
| 2019 | 3,351 |
| 2020 | 4,248 |
| 2021 | 5,211 |
| 2022 | 5,717 |
| 2023 | 6,310 |
| 2024 | 6,913 |
| 2025 | 7,528 |
| 2026 | 8,148 |
Source: Statista
Percentage of People Who Made Online Purchases in the Past Year
Homes in Australia completed at least biweekly online transactions in the preceding year, up from 1.6 million to 3.4 million households—an increase of 112% from the year before.
At the beginning of the outbreak, retail limits and worry about catching COVID-19 were two of the major causes influencing online shopping. Progressively taking the place of these initial objectives are comfort, better product accessibility, and cost efficiency.
In an Australian study from 2022, 31% of participants said they made purchases online at least once per week. Every month, more than five million families engage in internet purchasing. This number represents a 39% increase from 2019.
Purchase Frequency Among Online Shoppers in Australia in 2022
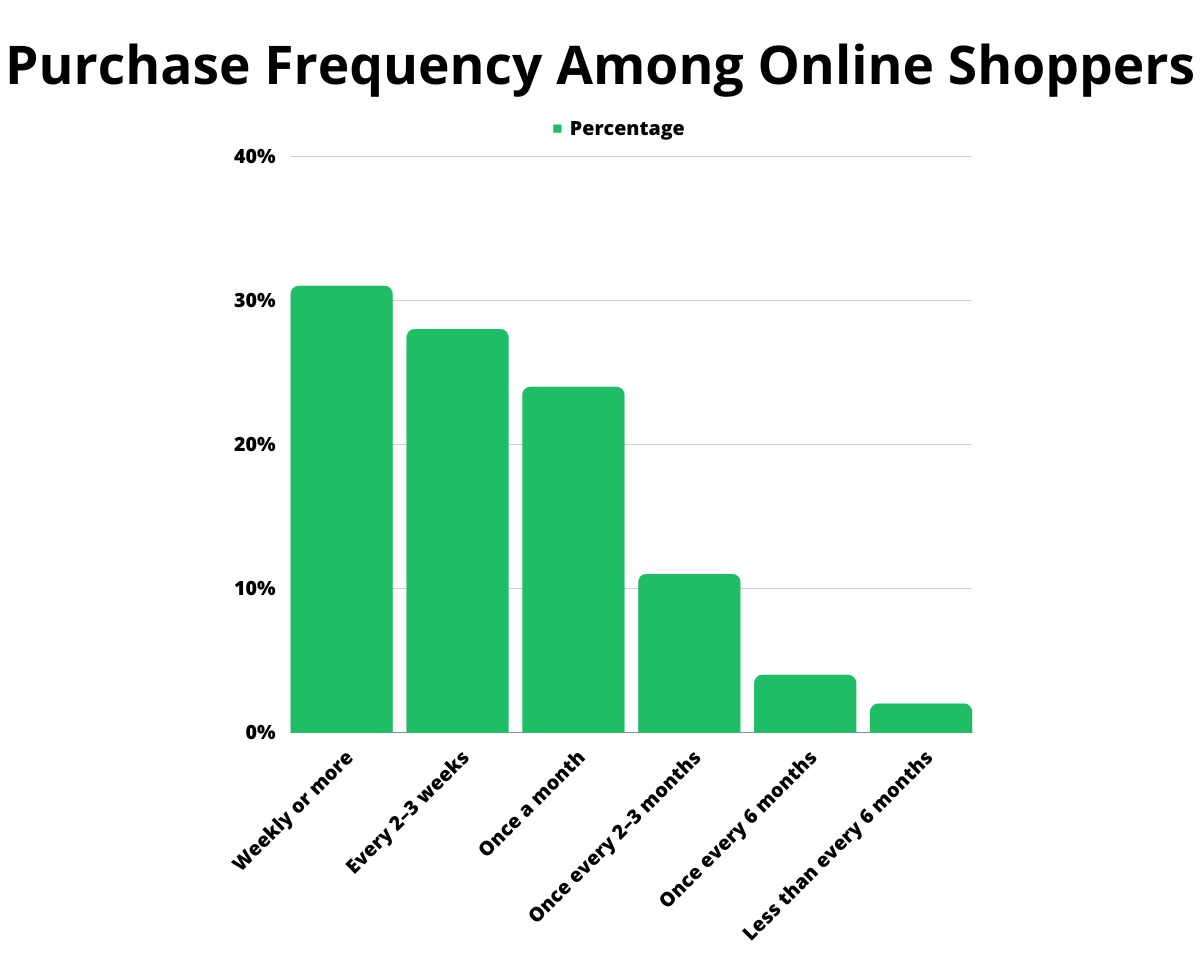
| Frequency | Percentage |
| Weekly or more | 31% |
| Every 2–3 weeks | 28% |
| Once a month | 24% |
| Once every 2–3 months | 11% |
| Once every 6 months | 4% |
| Less than every 6 months | 2% |
Source: Statista
Growth in Online Sales in Australia from April 2019 to April 2021
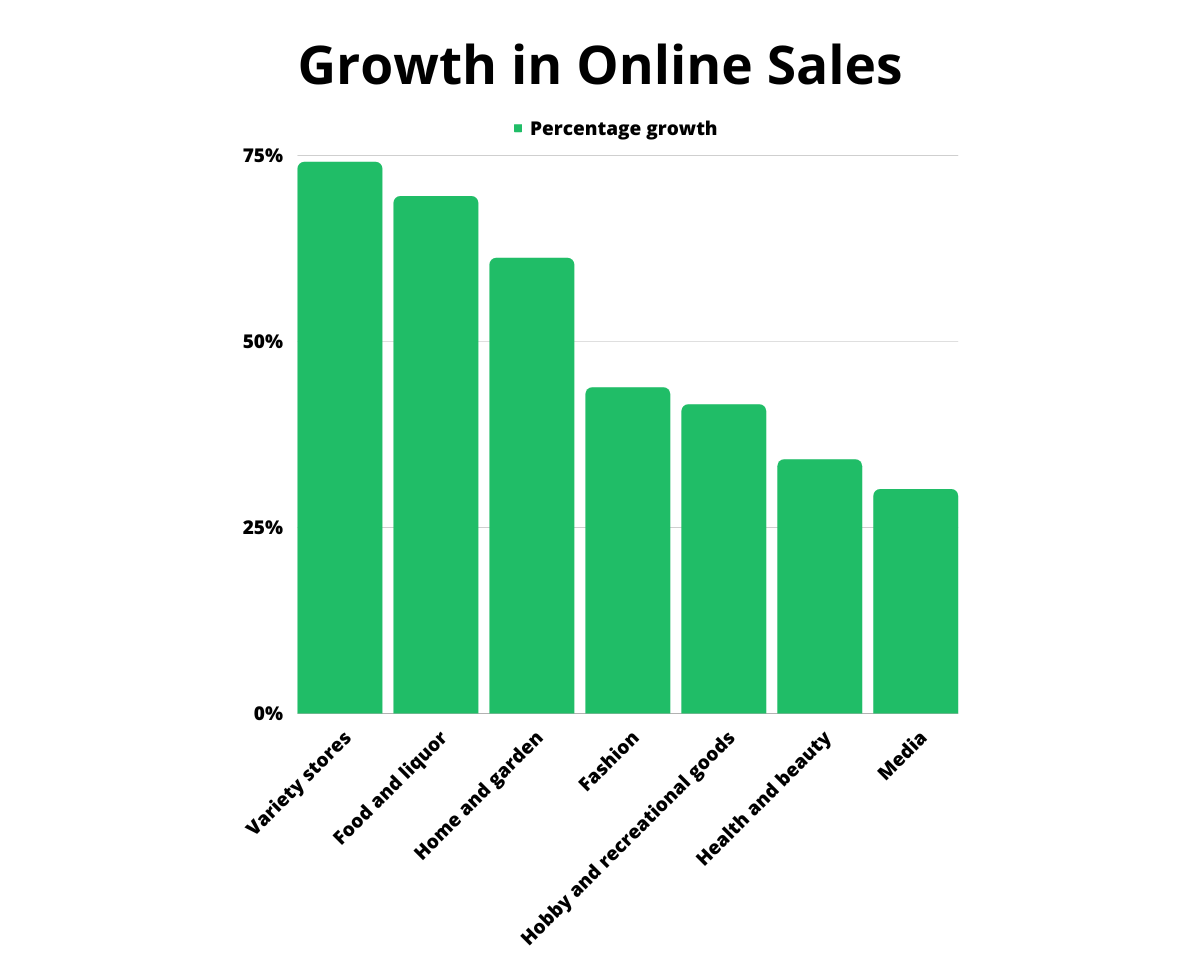
| Retailer | Percentage growth |
| Variety stores | 74.1% |
| Food and liquor | 69.5% |
| Home and garden | 61.2% |
| Fashion | 43.8% |
| Hobby and recreational goods | 41.5% |
| Health and beauty | 34.1% |
| Media | 30.1% |
Source: Statista
The Size and Inspiration of Online Transactions
Australians made a record-breaking $62.3 billion in purchases of tangible products throughout the year, ranging from clothes to basic household necessities. This indicates that at least four out of every five families engaged in online purchasing, increasing national growth by 12.3% on an annual basis.
Average Time Spent Online Shopping in Australia
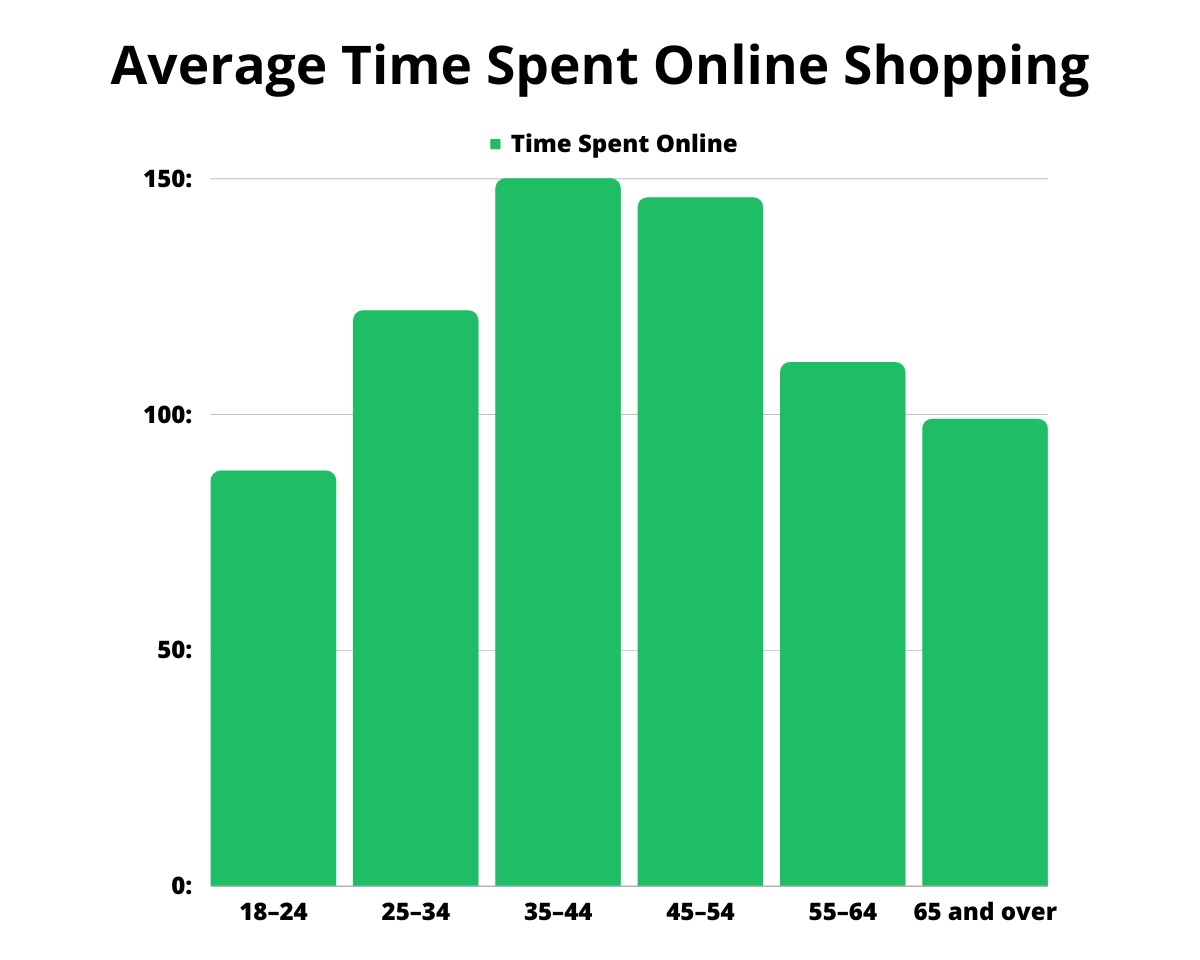
| Characteristics (in age) | Time Spent Online (in hours and minutes (hh:mm)) |
| 18–24 | 88:54 |
| 25–34 | 122:25 |
| 35–44 | 150:48 |
| 45–54 | 146:58 |
| 55–64 | 111:7 |
| 65 and over | 99:42 |
Source: Statista
This growth in time spent online has also affected transactions worldwide and has been inspired by some factors that potential consumers are exposed to in their time online. The main sources of inspiration for online shoppers worldwide in 2022 are:
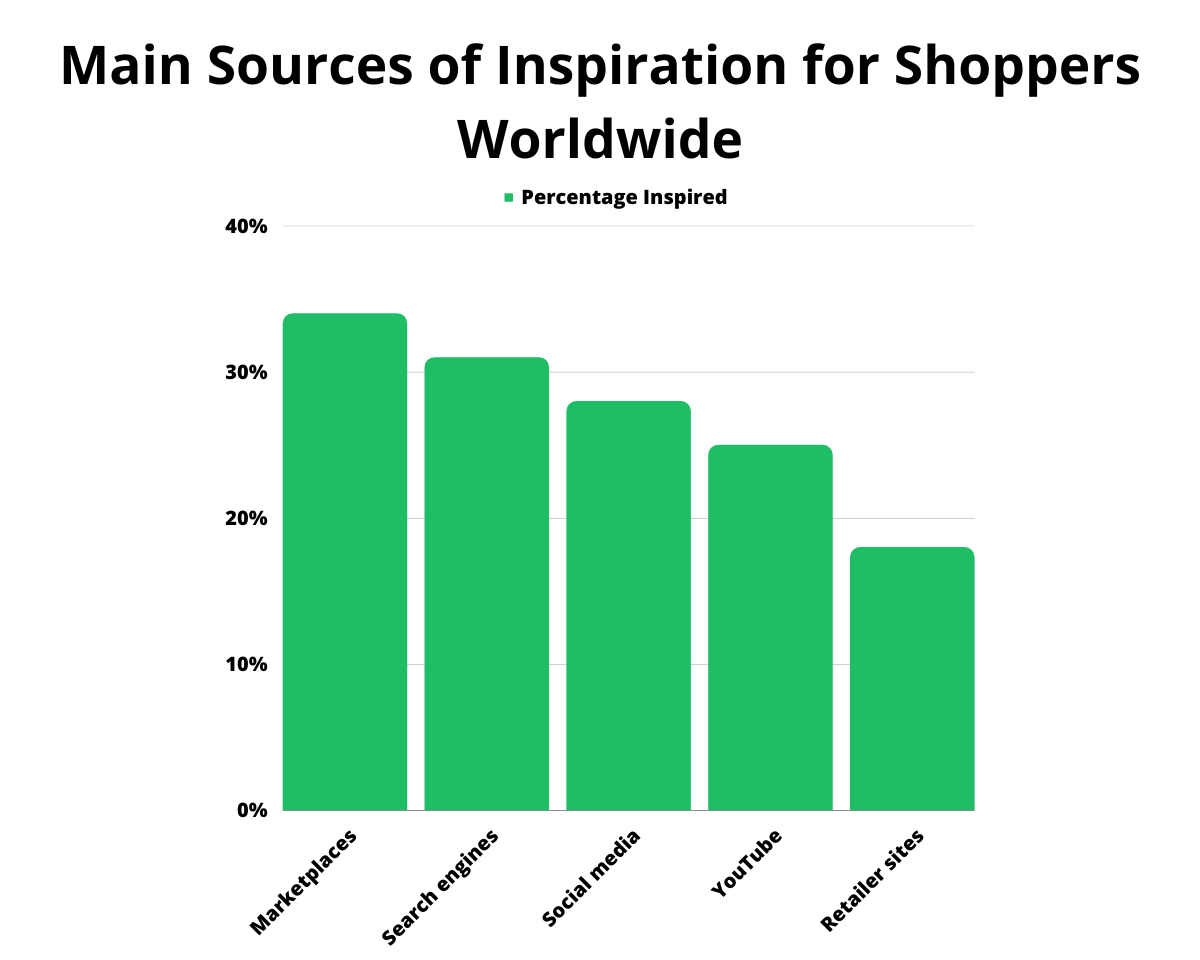
| Source of Inspiration | Percentage Inspired |
| Marketplaces | 34% |
| Search engines | 31% |
| Social media | 28% |
| YouTube | 25% |
| Retailer sites | 18% |
Source: Statista
Payment Methods that Facilitate E-commerce in Australia in 2022
E-commerce is not possible without the right payment method. Here are the means used for payment by consumers engaging in online purchases:
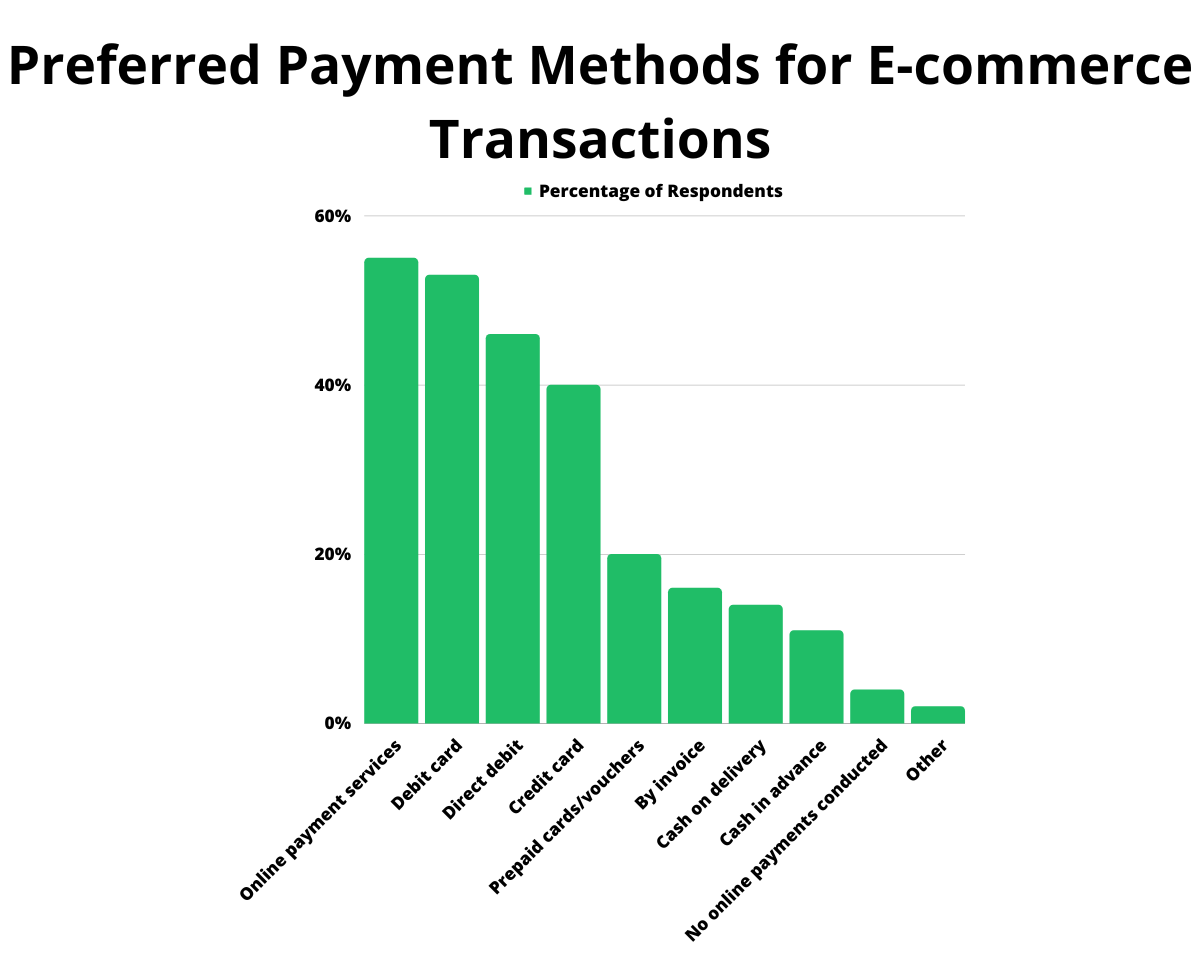
| Payment Method | Percentage of Respondents |
| Online payment services (e.g., PayPal, Amazon Pay) | 55% |
| Debit card | 53% |
| Direct debit | 46% |
| Credit card | 40% |
| Prepaid cards/vouchers | 20% |
| By invoice | 16% |
| Cash on delivery | 14% |
| Cash in advance | 11% |
| I have not conducted any payments online | 4% |
| Other | 2% |
Source: Statista
Share of Consumers Who Engage in Hybrid Online and In-store Purchasing in Australia in 2021
Despite the rise of e-commerce, the typical and physical method of trading still thrives. Here’s how consumers have continued to maximise the two methods:
| Consumer Behaviour | Percentage of Respondents |
| Browse products online and then purchase them in a retail store | 79% |
| Make purchases online after seeing the product at a retail store | 62% |
| Order goods online and pick them up in/at a retail store | 62% |
| Purchase on an app | 60% |
| Order grocery products online and have them delivered to my house | 52% |
| Make purchases on my phone from within a retail store on another retailer's site | 48% |
| Make purchases on my phone from within a retail store from that retailer’s website | 45% |
| Make purchases using a voice-activated smart home speaker (Google Home/Amazon Echo/others) | 30% |
Source: Statista
Factors Considered Very Important to Shoppers When Making an Online Purchase in Australia in 2021
| Factor | Percentage of Respondents |
| Free shipping | 53% |
| Discounts and offers | 52% |
| Quick and easy checkout | 46% |
| Good range of products on the website/app | 45% |
| High quality product images / gallery | 41% |
| Flexible payment options | 32% |
| Product reviews organized with the most relevant first | 27% |
| Retailer/brand allows to buy online and pick in-store | 27% |
| The retailer/brand website is optimized for my mobile devices | 26% |
| The retailer/brand has a shopping app | 23% |
| Product recommendations based on my purchase history | 21% |
| Product videos | 19% |
Source: Statista
Percentage of Consumers Who Shop Online and Offline on a Weekly Basis in the US, UK, and Australia in 2022
Although shoppers still use physical stores more often, online shopping continues to gain strength and acceptance as shown by this statistics:

| Online | Offline | |
| United States | 43% | 71% |
| UK | 44% | 73% |
| Australia | 39% | 76% |
Source: Statista
E-commerce Advantages in Australia
- Increased Reach and Visibility: Businesses in Australia can access a broader client base, become more visible and improve sales by using e-commerce.
- Cost Savings: Businesses can focus on other areas of their business by doing away with the necessity for a physical store, which also saves money on inventory and other resources.
- Convenience: Thanks to e-commerce, it is simpler and more convenient to buy goods and services because it eliminates the need to visit an actual location.
- Improved Customer Service: Customers may reach out to businesses with questions, grievances and reviews with ease.
- Increased Efficiency: Businesses can streamline their procedures and operations in Australia thanks to e-commerce, making them more productive.
Although people switched to e-commerce during COVID-19 due to safety reasons, it is more about convenience now. And in relation to the general benefits of e-commerce, here are some of the leading consumer benefits from e-commerce that led Australians to make online shopping:
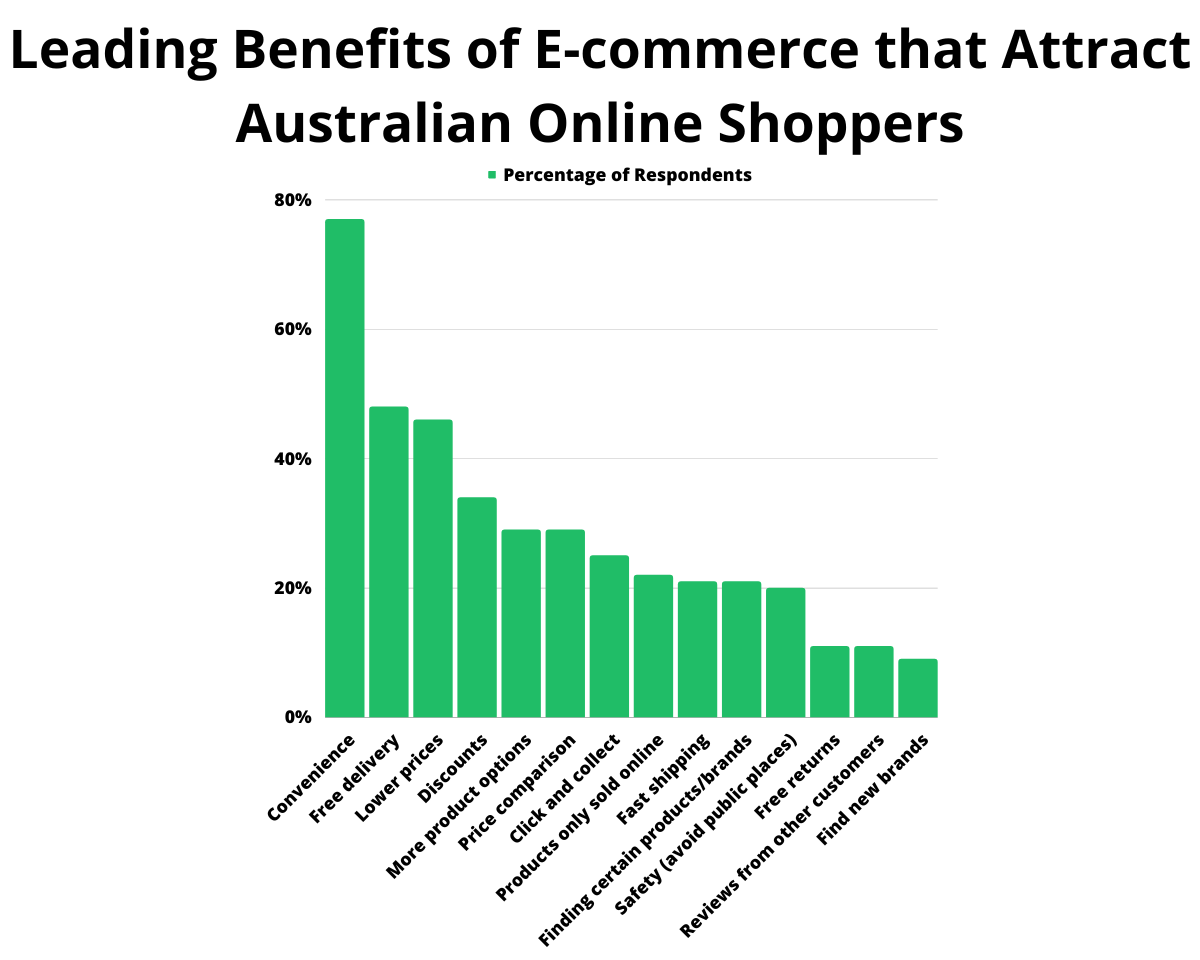
| Benefit Derived | Percentage of Respondents |
| Convenience | 77% |
| Free delivery | 48% |
| Lower prices | 46% |
| Discounts | 34% |
| More product options | 29% |
| Price comparison | 29% |
| Click and collect | 25% |
| Products only sold online | 22% |
| Fast shipping | 21% |
| Finding certain products/brands | 21% |
| Safety (avoid public places) | 20% |
| Free returns | 11% |
| Reviews from other customers | 11% |
| Find new brands | 9% |
Source: Statista
E-commerce Difficulties in Australia
- High Shipping Costs: Australia has some of the highest shipping prices in the world because of its remote location and the challenges associated with moving products there.
- Limited Market Strength: Australia is a sizable nation, yet its population is not very large. To make matters worse, the country is geographically isolated from the rest of the world.
- Limited Access to International Markets: Geographic isolation from other nations makes it challenging for Australian e-commerce firms to enter foreign markets. This implies that Australian retailers must concentrate on catering to the domestic market, which may restrict their room for expansion.
These disadvantages have not stopped people from switching to e-commerce, 10% of companies make 100% of their revenue online. The following shows distribution of businesses with e-commerce revenue in Australia 2021, by share of revenue:
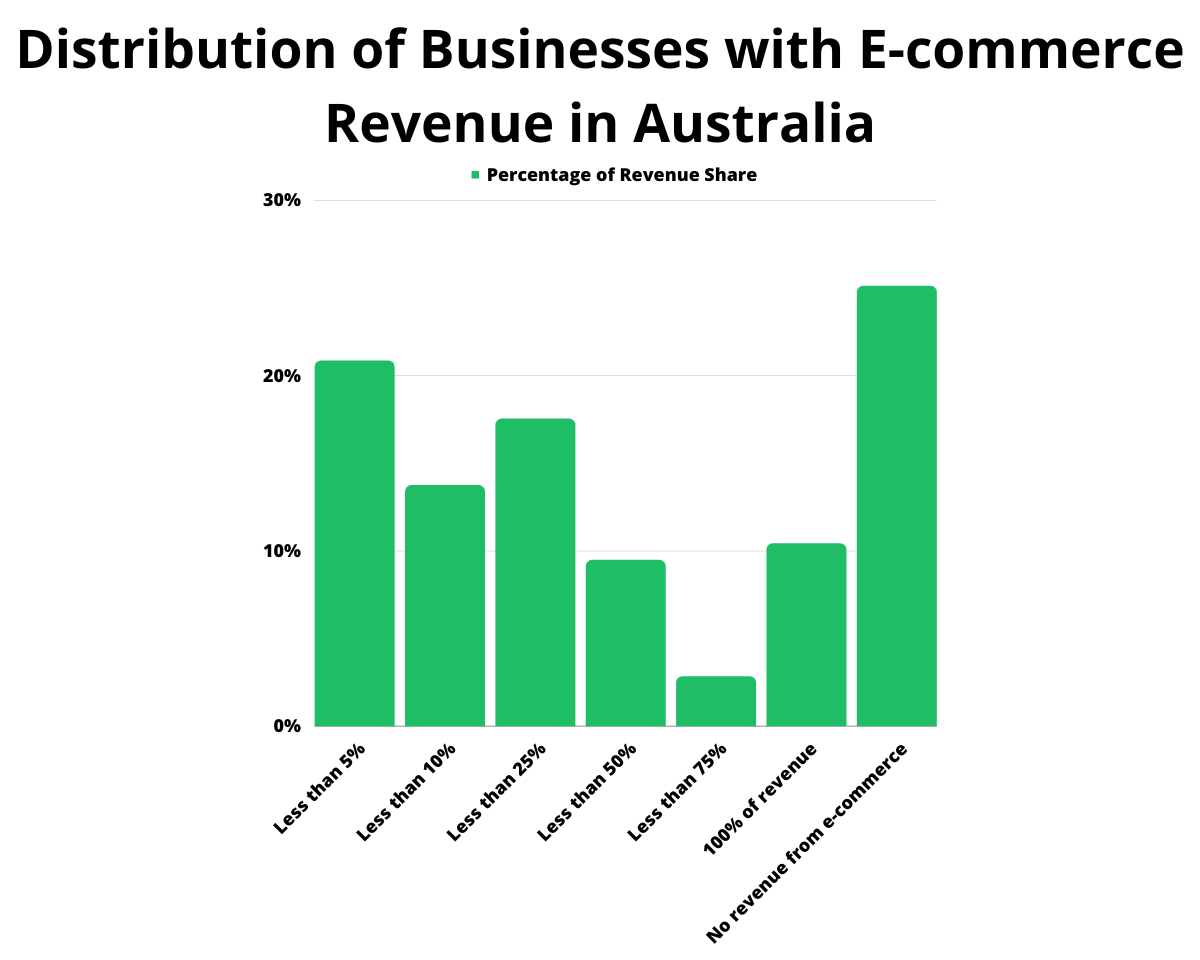
| Business Distribution | Percentage of Revenue Share |
| Less than 5% | 20.85% |
| Less than 10% | 13.74% |
| Less than 25% | 17.54% |
| Less than 50% | 9.48% |
| Less than 75% | 2.84% |
| 100% of revenue | 10.43% |
| No revenue from e-commerce | 25.12% |
Source: Statista
Conclusion
Although 2023 is expected to be more stable and have slower growth than the previous ones, there are still plenty of prospects for businesses.
These statistics illustrate the potential for online shops to enjoy an increase in revenue while also developing new relationships with customers that foster loyalty and a feeling of community.
The post-pandemic recovery of Australia's e-commerce market will be well underway by 2023, and sales will increase exponentially. Despite the projected economic slowdown, many buyers will still shop at and return to their favourite e-commerce brands.
The facts, analyses and trends mentioned point to one thing: global e-commerce isn't an option; it is inevitable. Your company's success and perhaps even growth depend on it.
